Know Your Territory.
Own Your Territory.
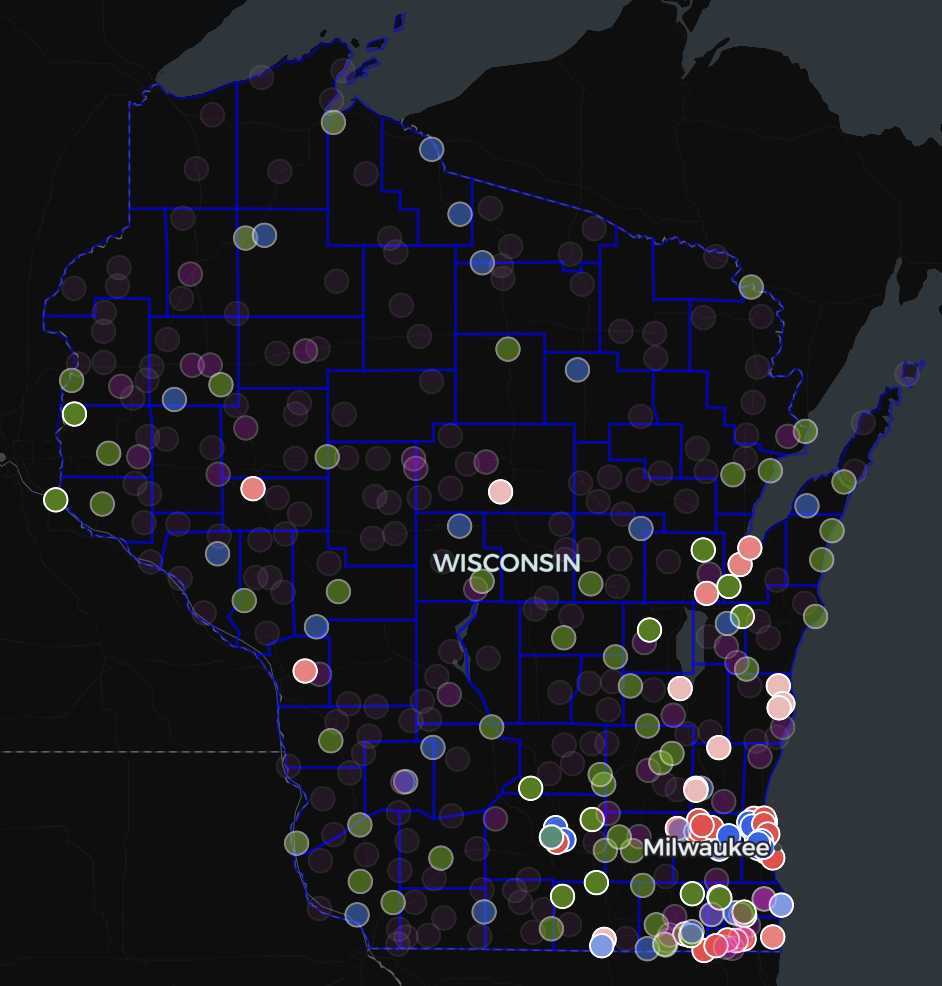
Edit data in real-time. Customize every pin's color and opacity. Switch between saved views instantly. See your data table alongside the map. Complete control over your location data.
Built for Teams Who Need Territory Intelligence
Whether you're planning territories, managing accounts, or optimizing routes—Incredimaps gives you the control you need.
Sales Teams
Plan territories, prioritize accounts by ACV and health, optimize routes, and see client status at a glance with satellite pins.
Territory Managers
Filter by boundaries, optimize routes across regions, manage waypoints, and switch between multiple territory views instantly.
Client Success
Visualize account health, track renewals, identify expansion opportunities, and see all account characteristics with satellite pins.
Marketing
Segment markets by geography, target campaigns by region, analyze territory penetration, and visualize customer distribution for strategic planning.
Maps That Match Your Workflow
Customize every aspect of your map visualization. Control pin colors, opacity, icons, and styling to match your workflow and brand—no more generic templates that don't fit your needs.
Instant Pattern Recognition
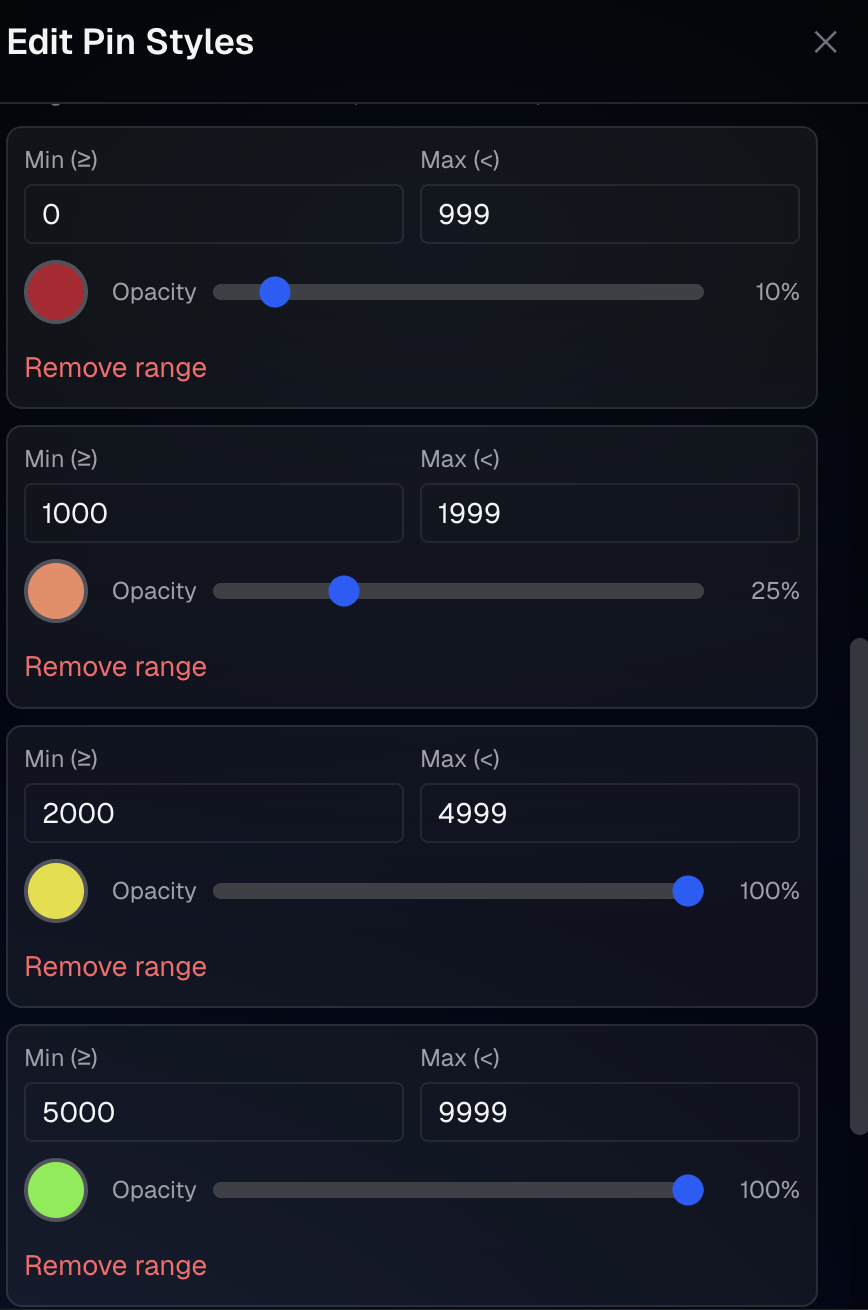
Fine-tune every pin's color and opacity independently. Categorical or numeric styling with full transparency control for layered visualizations that make patterns instantly clear.
See Your Data in Geographic Context
Add boundaries for companies, contacts, territories, counties, states, or your own GeoJSON overlays. Search boundaries, style them independently, and use them for filtering to see your data in the right geographic context—whether you're mapping customers, prospects, facilities, or any location-based data.
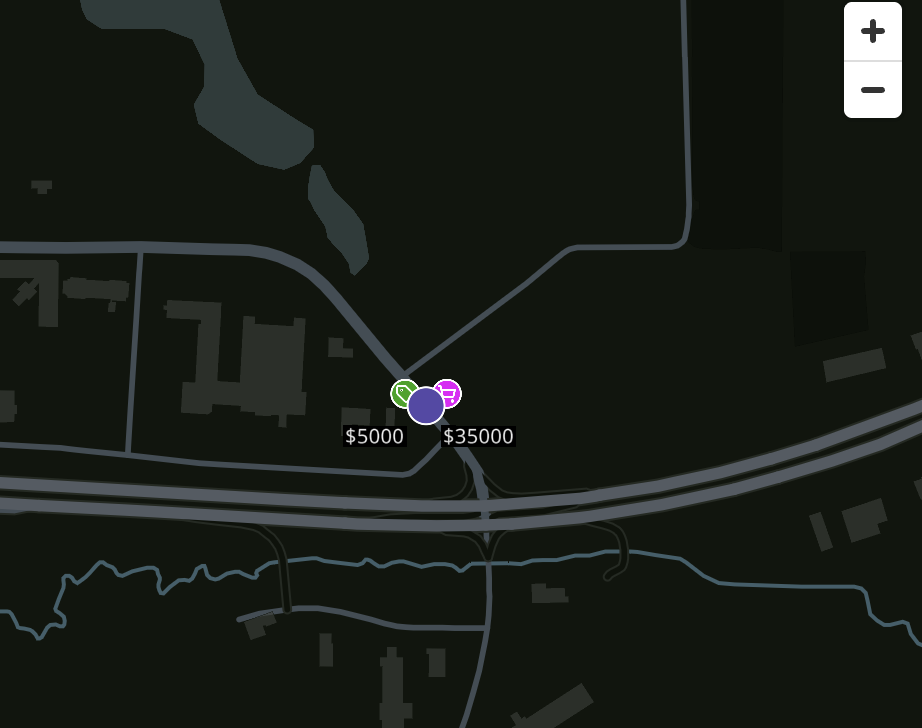
See All Account Characteristics at a Glance
Add multiple characteristics that orbit around your main pin. Display Client Status, ACV, Opportunity Size, Client Health, Implemented Features, and more as satellite pins that circle each account location—see everything at a glance.
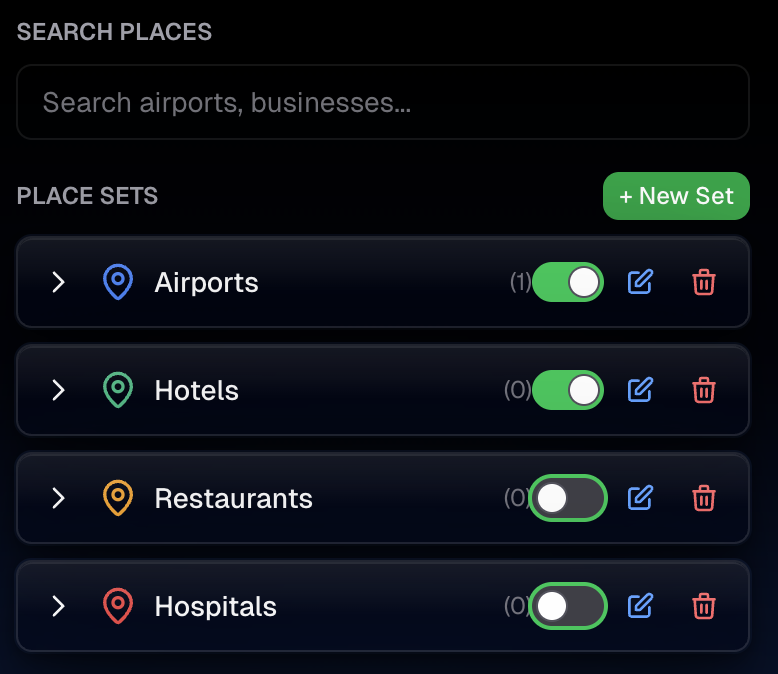
All Your Locations in One Place
Search and add places instantly. Create custom place sets with your own labels and categories. Build location collections for companies, contacts, facilities, or any points of interest—perfect for territory planning, route optimization, and analysis.
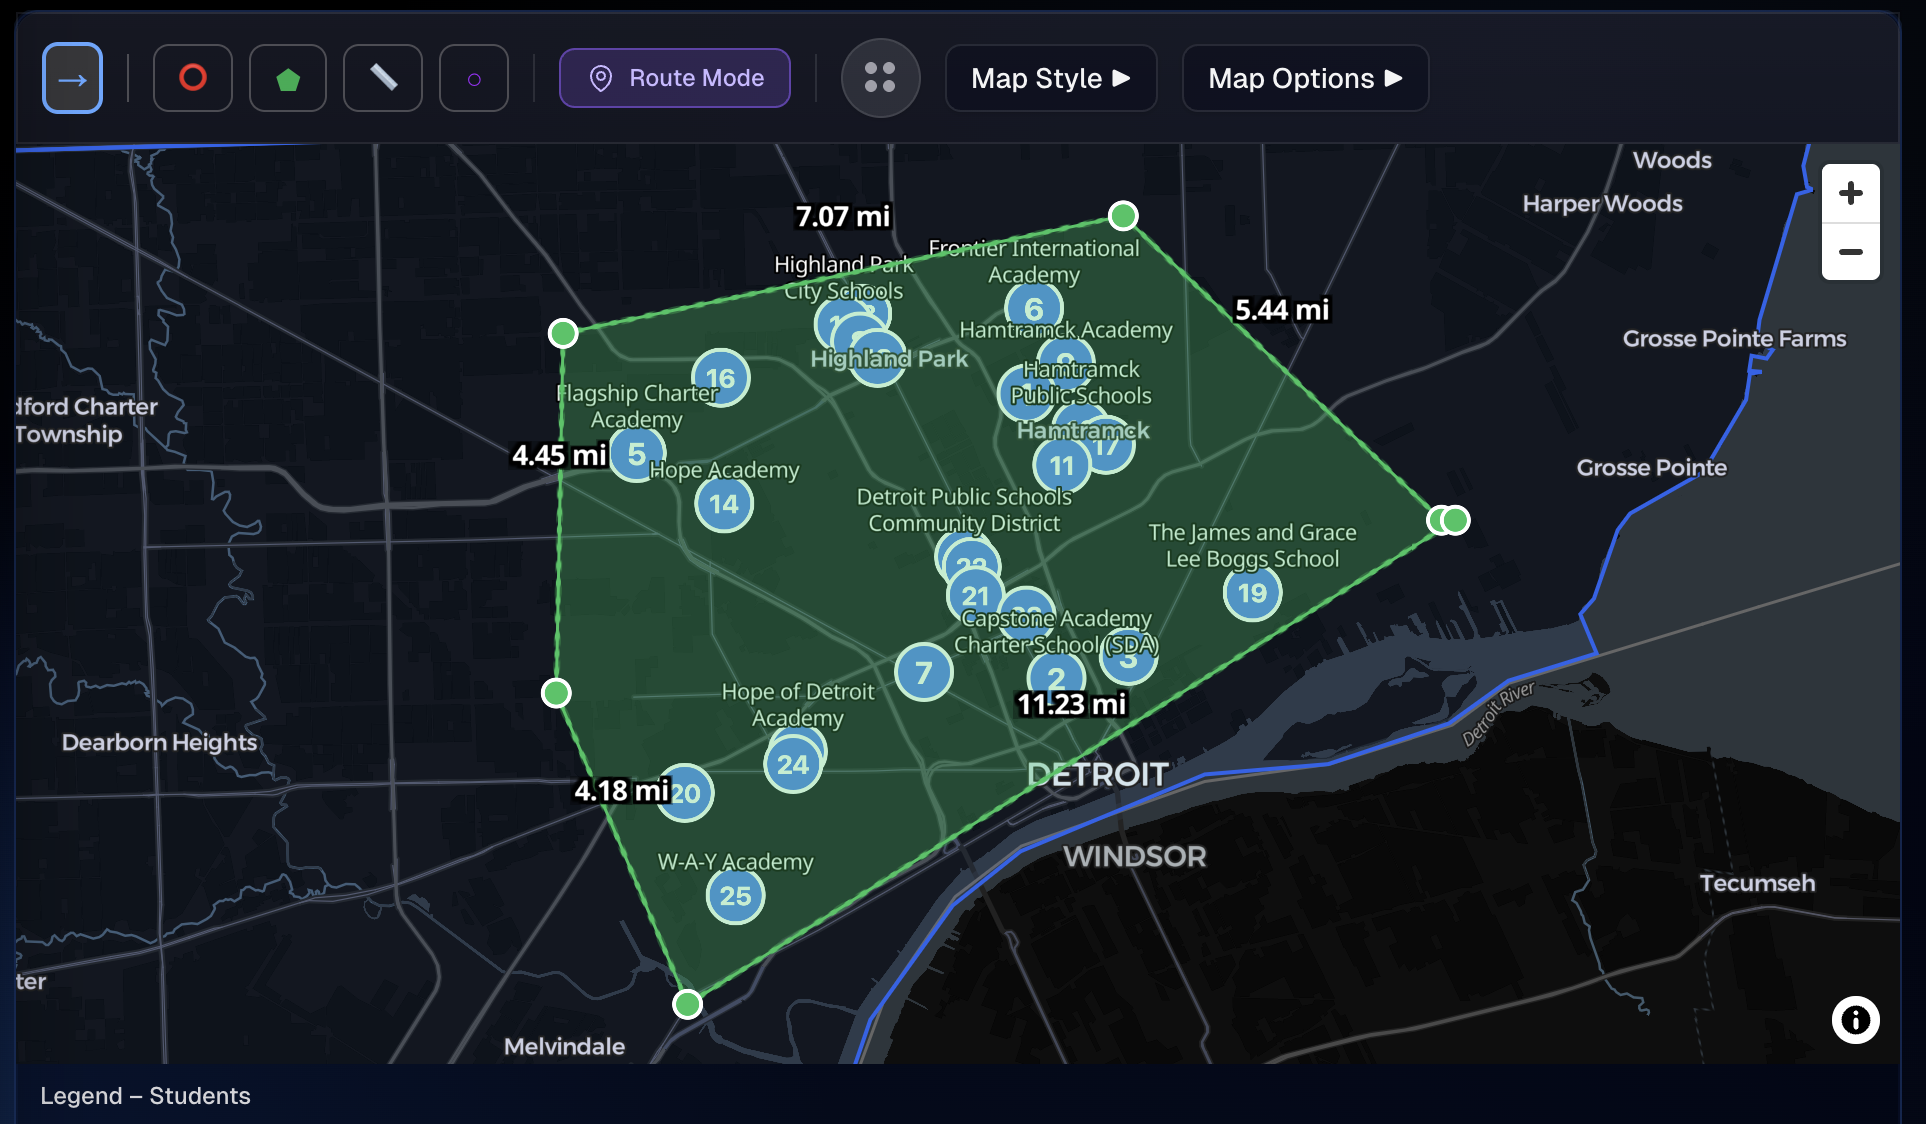
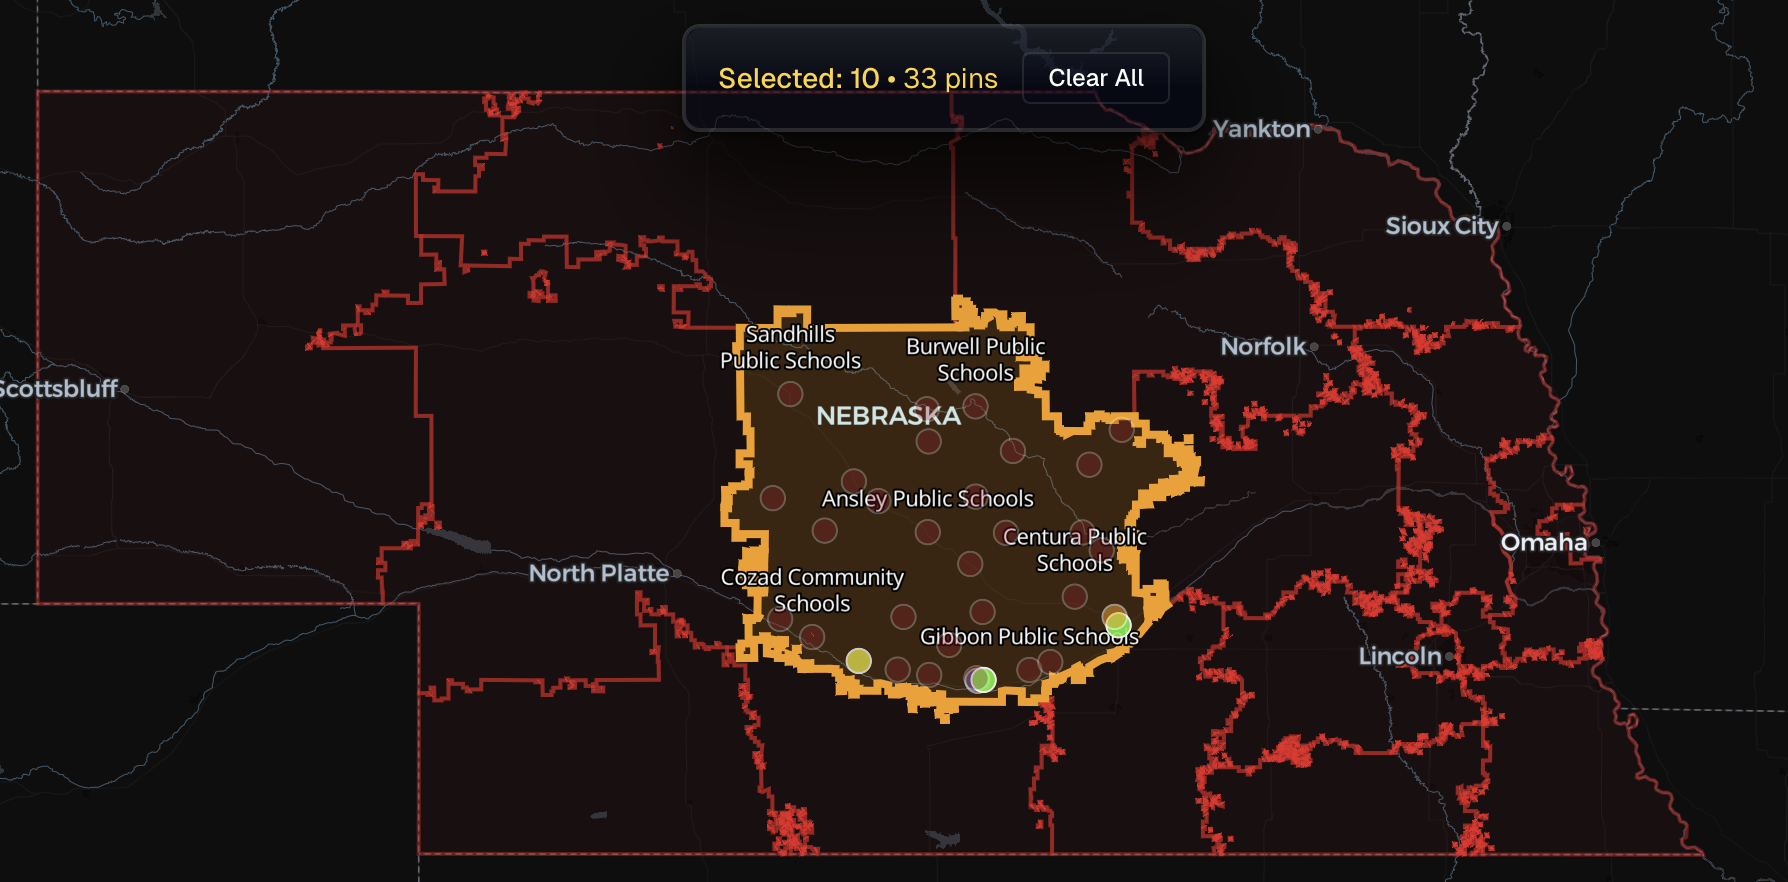
Target Exactly the Areas You Need
Draw circles, polygons, or custom shapes to target specific areas. Instantly filter your companies, contacts, or any location data by distance, boundaries, or custom regions. Perfect for territory analysis, market segmentation, and location-based insights.
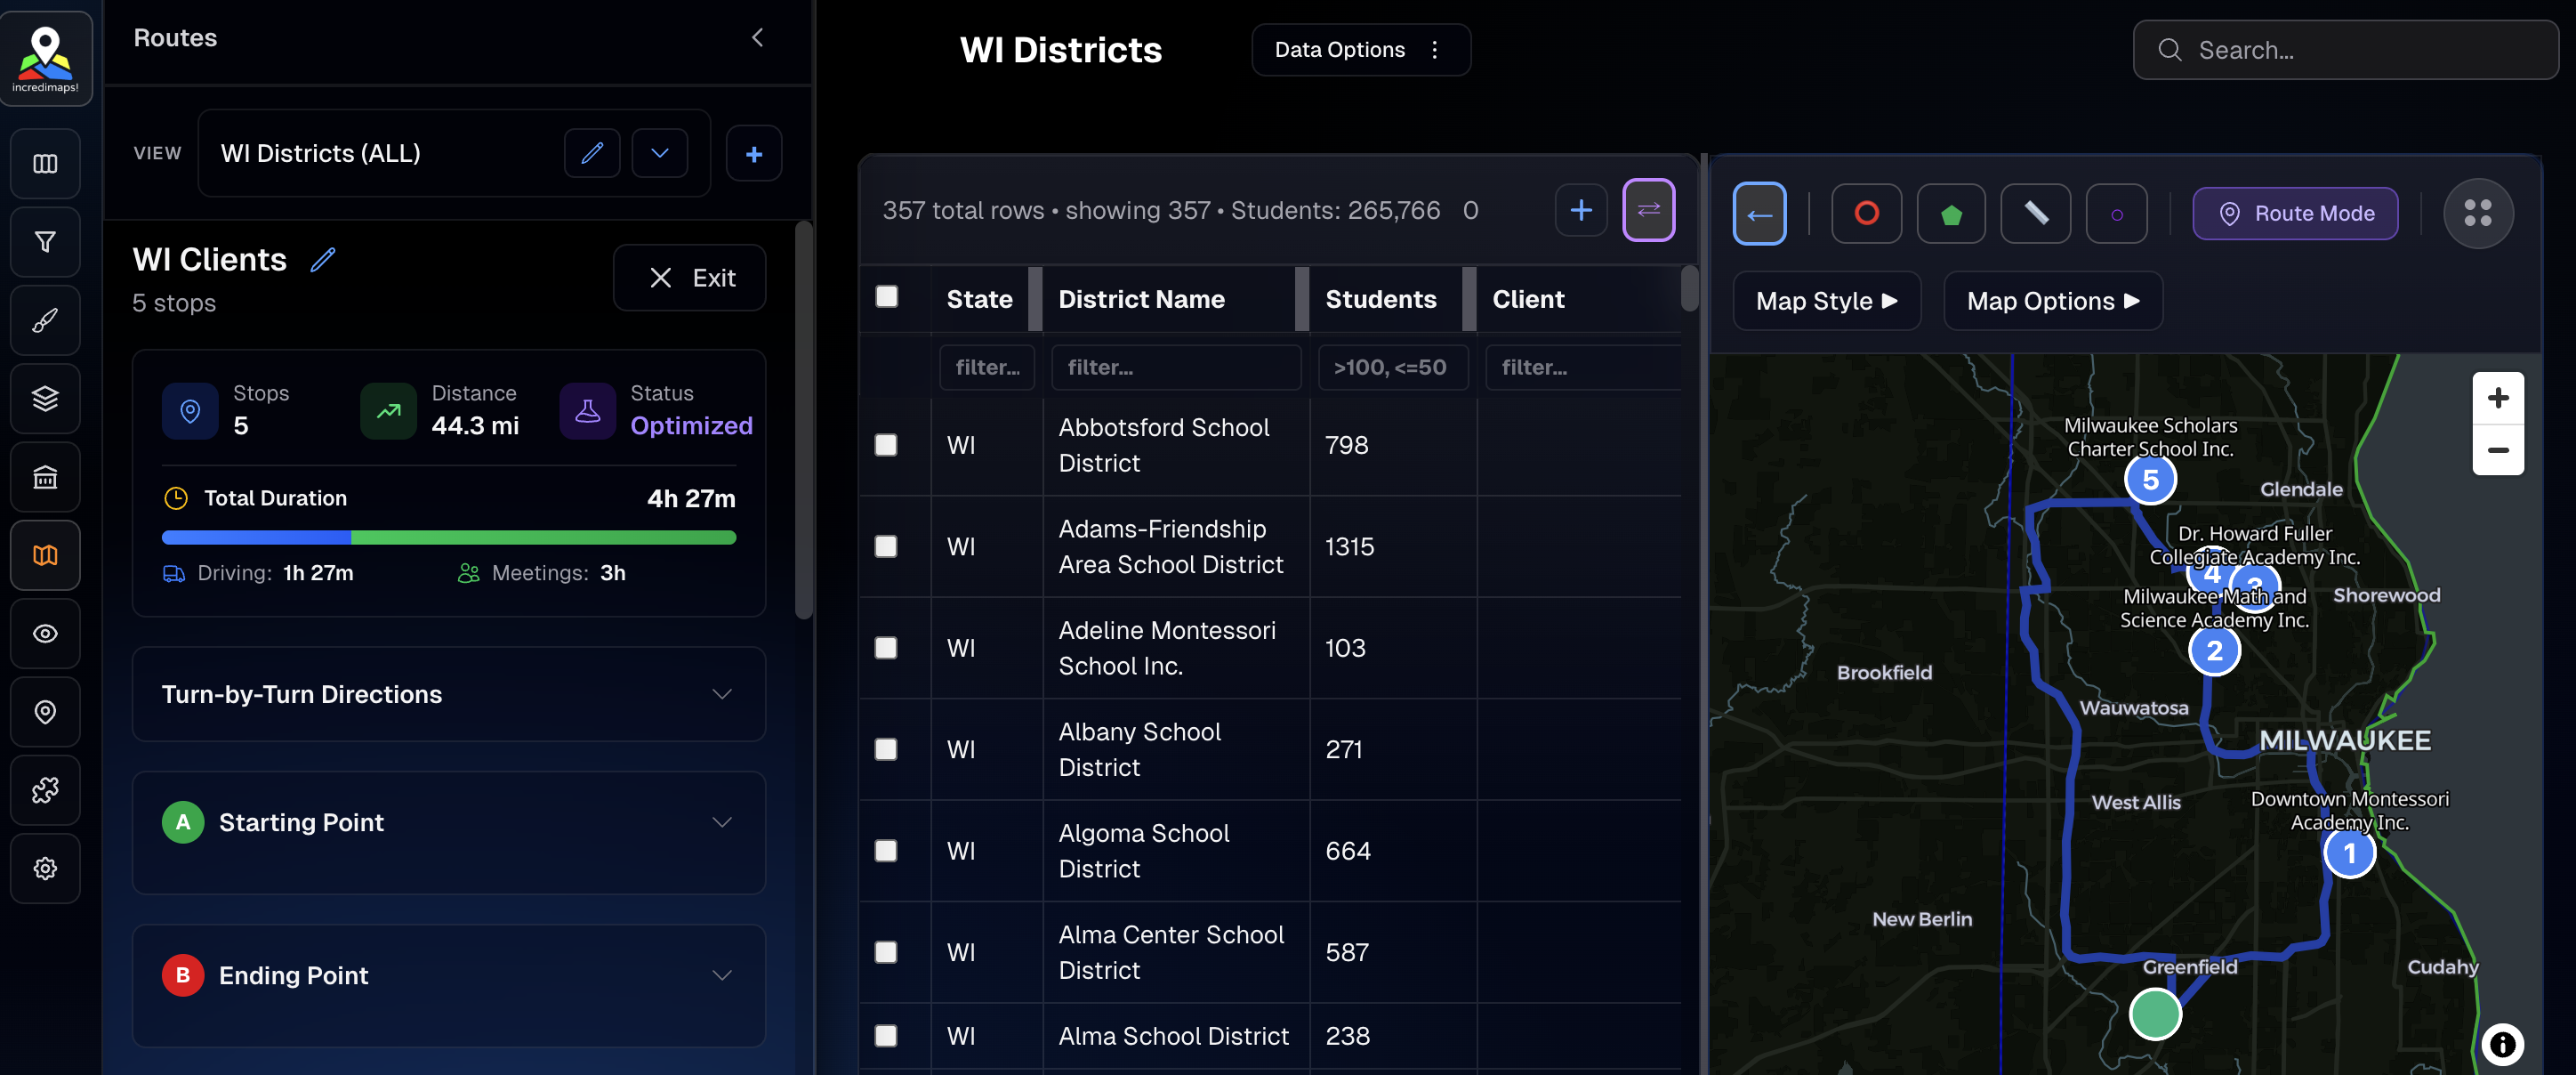
Plan Efficient Routes Automatically
Optimize waypoint order for efficient routes. Calculate distances, travel times, and get the best sequence automatically. Automate with calendars to simplify meeting invites. Plan multi-stop trips with intelligent routing that saves time.
No More Export-Edit-Import Cycles
Edit records directly in the table. Changes sync instantly to the map. Add, modify, or delete fields on the fly without breaking your visualization—no more switching between tools.
AI-Powered Territory Intelligence
Get intelligent insights and recommendations for your territory planning. MIKE AI analyzes your location data patterns—whether companies, contacts, facilities, or any geographic data—suggests optimizations, and helps you make data-driven decisions for better territory management.

Complete Control Over Your Location Data
Every feature designed for flexibility and real-time collaboration
Custom Icons & Styling
Upload custom icons or choose from our library. Control size, color, and style per category. Make your maps uniquely yours.
Instant View Switching
Save multiple map configurations—filters, styles, layers, pin settings. Switch between views instantly. Perfect for comparing scenarios or sharing specific perspectives.
Dynamic Field Management
Add custom fields on the fly. No schema changes, no migrations. Create text, number, boolean, or enum fields instantly and start using them immediately.
Data Merge & Join
Merge multiple spreadsheets into a single unified dataset. Join on common fields, handle duplicates intelligently, and create comprehensive data views from multiple sources.
Fuzzy Logic Matching
Intelligent fuzzy matching for joining datasets with imperfect data. Handles typos, abbreviations, and variations automatically. Merge records even when field names don't match exactly.
Reorder Layers
Drag and drop to reorder visualization layers. Control which data appears on top. Perfect for layering multiple datasets or overlays with precise visual hierarchy.
Search Layers & Pins
Quickly search across all layers and pins. Find locations by name, address, or any field value. Instant results with highlighting and zoom-to-location functionality.
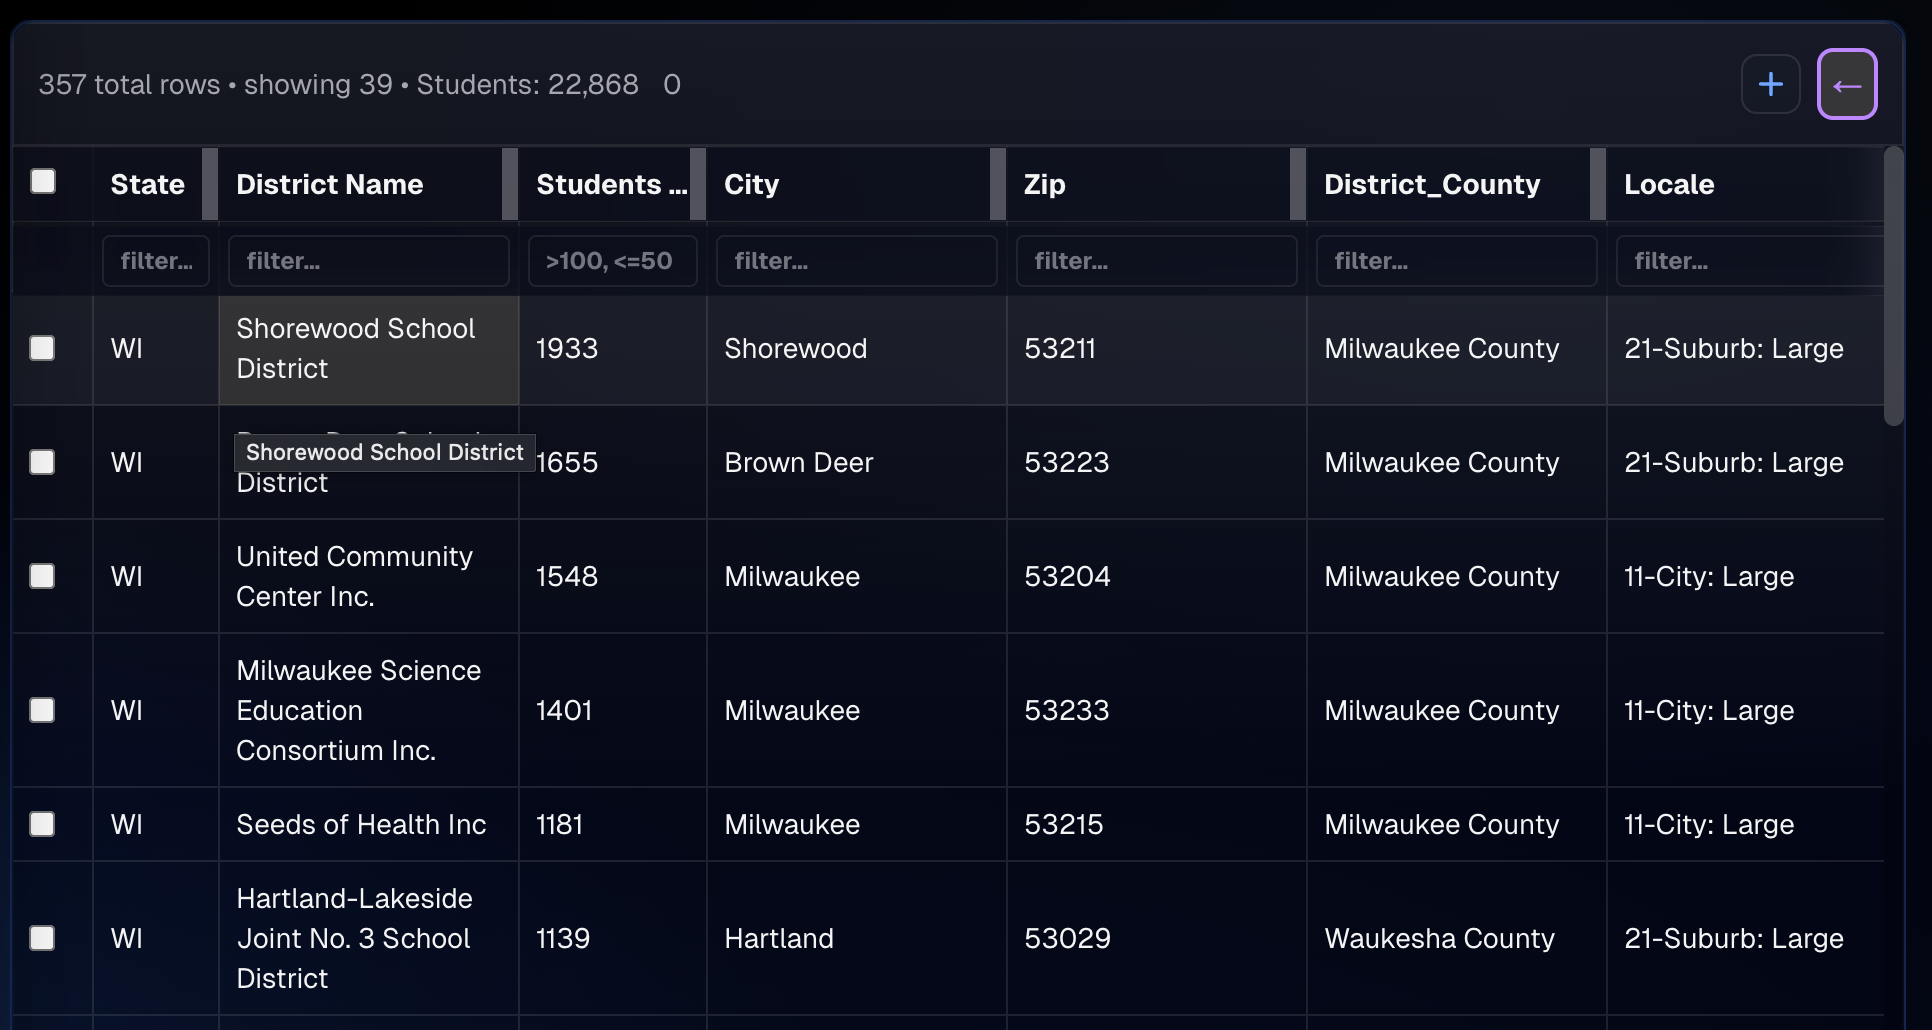
Filter Table Data
Filter table rows on the fly with instant results. Apply multiple filters simultaneously. See filtered counts and sync filters between table and map views seamlessly.
Sharing Workspaces
Share workspaces with team members. Collaborate in real-time, control access levels, and keep everyone on the same page with shared views and configurations.
Become a Territory Tactician
Read what others are saying about Incredimaps!
"Incredimaps would have saved me years on my territory planning and engagement strategy. Knowing who to target by county and region was painstaking. I was literally printing maps and hanging them in my office."
"Having multiple views made it so much easier to support reps in different regions. Before, I was scrolling through menus to adjust views. Now, I can see exactly what I need to see when preparing for meetings."
"Satellite pins has been an absolute gamechanger. Seeing things like client status, client health, ACV, opportunities, and deal size at a glance makes it so much easier to strategize and execute."
Simple Pricing
Choose the plan that fits your workflow
Free
- ✓Up to 50 records
- ✓2 workspaces
- ✓1 layer
- ✓Real-time data table editing
- ✓Pin color & opacity control
- ✓Custom icons & styling
- ✓3 saved views
- ✓Basic spatial filtering
- ✓Free geocoding (Nominatim)
Starter
- ✓Everything in Free
- ✓Up to 200 records per file
- ✓Unlimited saved views
- ✓Data merge & fuzzy logic
- ✓Custom overlays & boundaries
- ✓Advanced spatial filtering
- ✓Radius & polygon support
- ✓Charting & analytics
- ✓Free geocoding (Nominatim)
Growth
- ✓Everything in Starter
- ✓Up to 5,000 records per file
- ✓10 workspaces
- ✓Unlimited layers
- ✓Sharing workspaces (up to 5 team members)
- ✓Advanced analytics
- ✓Free geocoding (Nominatim)
Pro
- ✓Everything in Growth
- ✓Unlimited records per file
- ✓Unlimited workspaces
- ✓Route optimization
- ✓AI analysis
- ✓Unlimited team sharing
- ✓Advanced charting & analytics
- ✓Free geocoding (Nominatim)
Enterprise
- ✓Everything in Pro
- ✓CRM API integrations
- ✓HubSpot integration
- ✓Salesforce integration
- ✓Microsoft integration
- ✓Custom API access
- ✓Fast geocoding (Google Maps API)
Frequently Asked Questions
Why not just use Google Maps?
You can, but you won't have the flexibility to truly work with your location data. Adding multiple views, customizing pin types, and adjusting opacity make it easier to visualize your data. Adding layers on top of your pins allows you to segment your locations. Ever wanted to filter your data based on multiple characteristics, or quickly select a group based on a defined radius or custom area? None of that is possible with Google Maps—but you can do it in seconds with Incredimaps! Ever wanted to update your map? You'll need to manually edit and reupload your spreadsheet, which isn't a great workflow and is a huge waste of time and effort. There's just so much more to explore. Not convinced? Try it for yourself for free and let us know what you think.
How do I get my data on the map?
Upload a CSV or Excel file with addresses, and we'll automatically geocode them. We support CSV, Excel (XLSX), GeoJSON, and KML files. If your data already has coordinates, we'll detect and use those. Your map is ready in seconds—no manual setup required.
Can I combine multiple spreadsheets into one map?
Absolutely. Merge multiple datasets into a unified view, even when field names don't match exactly. Our fuzzy logic matching handles typos, abbreviations, and variations automatically. Pull together customer lists, sales data, location information, and more—all in one map. Perfect for combining data from different sources or time periods.
Can I edit data in real-time?
Yes! Edit any cell in the data table and see changes reflect instantly on the map. Add custom fields on the fly without schema changes. All edits are saved automatically. No more export-edit-import cycles—update your data and your map updates immediately.
What are saved views and why are they important?
Saved views let you capture a complete map configuration—filters, styles, layers, and pin settings—and switch between them instantly. Create a view for each region or analysis perspective. Compare scenarios, share specific perspectives with your team, or quickly return to a previous analysis. It's like having multiple maps without the complexity.
How much control do I have over pin styling?
Complete control. Set colors and opacity per category or numeric range. Upload custom icons or choose from our library. Control size, color, and style independently for each visualization layer.
Ready To Own Your Territory?
Start visualizing and editing your location data today. No credit card required.
Get Started Free